Entity Matching with Similarity Maps and Deep Learning
Source:vignettes/dl-matching.Rmd
dl-matching.RmdThe example concisely introduces the basic concepts and functionality of the package. Its goals are (i) to bring the reader up to speed with how to use the package to fit entity-matching models and (ii) to familiarize the reader with the basic concepts that are used in the documentation and naming conventions of the package. For simplicity, we use a deep learning matching model for this example. Examples of neural-symbolic matching models are given in the Neural-symbolic Entity Matching and Reasoning vignettes.
Prerequisites
Load the libraries we will use and set the seed for reproducibility.
##
## Attaching package: 'neermatch'
## The following object is masked from 'package:tensorflow':
##
## evaluatePreprocessing
The preprocessing stage aims to bring the data in a form compatible with the neermatch package’s calling conventions. The package expects the data to be in the form of two data frames, left and right, that contain the entities to be matched. The package also expects a third data frame, matches, that contains the indices of the matching entities in the left and right data frames. We illustrate the calling convention by constructing a toy example.
Left Data Set
The data used in this example is constructed from a subset of the game_reviews dataset shipped with the package (see the game_review documentation). The subset is created by selecting all the records in game_reviews having titles starting with either "Metal Slug" or "Metal Gear". The selection code is replicated here to keep the example code self-contained. Following the package’s naming convention, we name the resulting data frame left.
left <- neermatch::game_reviews[
  startsWith(neermatch::game_reviews$title, c("Metal Gear", "Metal Slug")),
  c("title", "platform", "year", "score", "reviews", "developer")
]
Right Data Set
What is the right data frame in this example? We construct the right data frame by copying the left data frame and introducing noise in the title and developer columns. Three characters are randomly removed from the title column, and one character is randomly removed from the developer column.
In addition, we create three duplicate matching records on the right data frame to illustrate that the matching models of the package can be used to link datasets with records/entities having either one-to-many or many-to-many relations.
By construction, the left and right data frames in our examples have the same columns. In practice, this is not always the case. For such cases, the neermatch package supports specifying different columns of the left and right data frames. To illustrate how the package can be used in such cases, we rename the developer column in the right data frame to dev.
right <- left
duplicates <- sample(seq.int(nrow(right)), 3)
right <- rbind(right, right[duplicates, ])
right$title <- sapply(right$title, function(x) {
  paste0(unlist(strsplit(x, ""))[-sample(1:nchar(x), 3)], collapse = "")
})
right$dev <- sapply(right$developer, function(x) {
  paste0(unlist(strsplit(x, ""))[-sample(1:nchar(x), 1)], collapse = "")
})
right <- right[, c("title", "platform", "year", "score", "reviews", "dev")]
Matches Data Set
The matching examples are passed to the matching models as pairs of indices. We do not need to provide non-matching examples. The models automatically pick non-matching examples from the Cartesian product of the left and right data frames as long as their indices are not in the matches data frame. For this application, the matches are constructed by the rows of the left and right data frames with the same index and the {r} len(duplicates) duplicate matches we created.
Matching Model Setup
A matching model initialization requires instructions on constructing the similarity map between the left and right datasets. The instructions are passed to the model as a named list that specifies
- which fields are used from each dataset and how they are associated with each other, and
- how to encode them, i.e., how to calculate the similarity values.
If the column names of the left and right are the same, it suffices to supply the common name to the similarity map instruction list (see, e.g., the title, platform, and year items below). If two columns have different names, the instruction should have the form left_name~right_name, as it is, for instance, the case for the developing studio in this application (see item developer~dev). Not all columns of the datasets need to be used in the instructions. We do not use the scores and reviews columns in this example.
The model can be instructed to calculate one or more similarities for each column association. For instance, the instructions of this example specify two similarity calculations for the platform and year associations and one for the title and developer~dev. The neermatch provides a set of predefined similarity functions that can be used in similarity maps. The string similarities and ratios are calculated using RapidFuzz. The complete set of predefined functions can be retrieved by calling the available_similarities() function.
instructions <- list(
  title = list("jaro_winkler"),
  platform = list("levenshtein", "discrete"),
  year = list("euclidean", "discrete"),
  `developer~dev` = list("jaro")
)

similarity_map <- SimilarityMap(instructions)
print(similarity_map)
## <neer_match.similarity_map.SimilarityMap object at 0x7f11ecc67a00>A matching model object is constructed by passing the similarity map instructions. The model prepares encoding operations based on the passed instructions and uses them whenever the model is fitted or evaluated. We skip the construction details of the model in this example and refer the interested reader to the documentation entries of the DLMatchingModel, and the Python RecordPairNetwork, and FieldPairNetwork classes.
model <- DLMatchingModel(similarity_map)The model is compiled in the usual (keras) way. The compile function wraps the tensorflow.keras.Model.compile function, so all the functionality and options in the latter can be used here.
Matching Model Fit and Evaluation
The model is fitted using the fit function (see the fit documentation for details). The fit function extends the functionality of tensorflow.keras.Model.fit to accommodate the entity matching problem requirements. Firstly, instead of passing features and label arguments, fit expects the left, right, and matches data frames.
During training, counterexamples of matching records are automatically selected from the cross-product of left and right data frames based on the mismatch_share parameter. Including all the non-matching examples can lead to a highly unbalanced matching dataset. For each record in the left data set, appearing in k examples in the matches data set, there are up to n - k counterexamples, where n is the number of records in the right data set. The mismatch_share parameter controls the ratio of counterexamples to matches. For instance, if mismatch_share = 0.5, the encode function selects 50% of the possible counterexamples for each match. The counterexamples are selected randomly from the right dataset.
For instance, the left and right data sets in this example have {r} nrow(left) and {r} nrow(right) records, respectively, and the matches data set has {r} nrow(matches) records. This allows us to construct {r} nrow(left) * nrow(right) - nrow(matches) non-matching examples. We set mismatch_share = 0.2, which means that for each matching example provided in matches, we get {r} int(0.2*(nrow(matches.) - 1)) non-matching examples (the integer part, i.e., the floor, of the number of counterexamples used).
The remaining arguments are similar to tensorflow.keras.Model.fit.
model |> fit(
  left,
  right,
  matches,
  epochs = 1L, #100L,
  batch_size = 32L,
  verbose = 0L
)
## <keras.src.callbacks.history.History object at 0x7f1234a93340>The evaluate function overloads the tensorflow.keras.Model.evaluate function (see also the evaluate documentation). Similar to fitting a matching model, the evaluate call expects left, right, and matches data sets.
model |>
  evaluate(left, right, matches, verbose = 0L)
## [1] 0.6557202Predictions and Suggestions
Matching predictions can be obtained in two ways from the fitted model. Either by calling predict or by calling suggest. The predict function returns a vector of prediction probabilities for each combination of left and right records. The prediction probabilities are stored in row-major order. First, the matching probabilities of the first row of left with all the rows of right are given. Then, the probabilities of the second row of left with all the rows of right are given, and so on. In total, the predict function returns a vector with rows equal to the product of the number of rows in the left and right data sets.
model |>
  predict(left, right, verbose = 0L) |>
  ecdf() |>
  plot(main = "CDF of DL Matching Probabilities", xlab = "Matching Probability")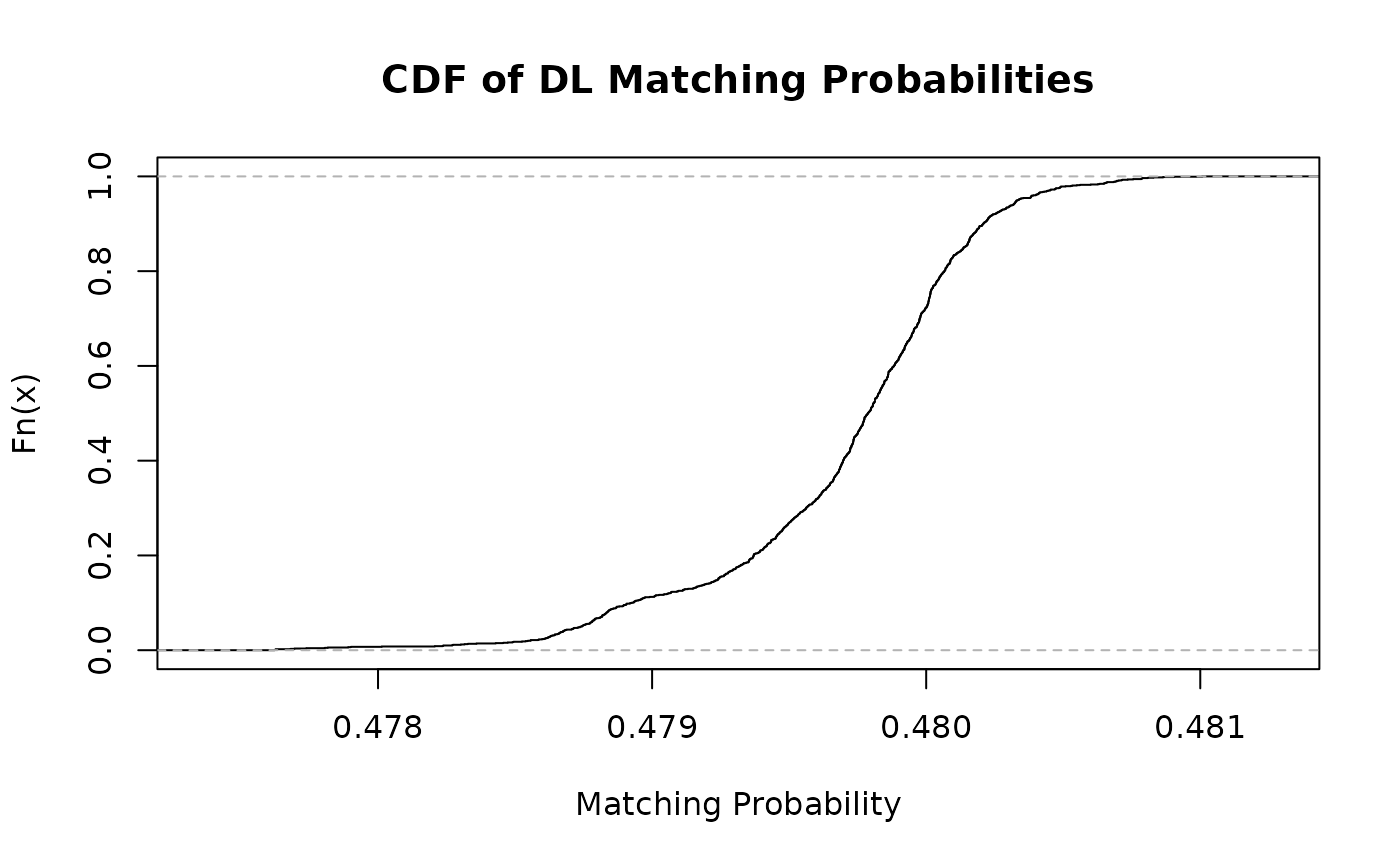
The suggest function returns the best matching predictions of the model for each row of the left dataset. The prediction probabilities of predict are grouped by the indices of the left dataset and sorted in descending order. The caller can choose the number of returned suggestions by setting the count argument of suggest.
suggestions <- model |>
  suggest(left, right, count = 3L, verbose = 0L)
suggestions["true_match"] <- apply(suggestions[, c(1, 2)], 1, function(r) {
  any(r[1] == matches[, 1] & r[2] == matches[, 2])
})
duplicates <- matches[(nrow(matches) - 2):nrow(matches), c("left", "right")]
suggestions["duplicate"] <- apply(suggestions[, c(1, 2)], 1, function(r) {
  any(r[1] == duplicates[1] & r[2] == duplicates[2])
})
rmarkdown::paged_table(suggestions, options = list(rows.print = 12))